Overview
Complete video scopes for analyzing your viewport: Histogram, Waveform, Vectorscope, and RGB Parade.
Opening the Plugin
Method
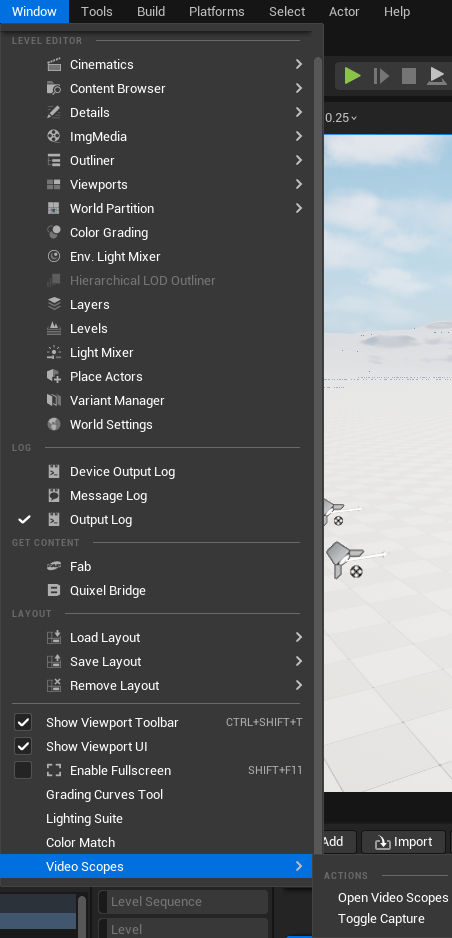
In the Unreal Editor top menu bar, go to Window > Video Scopes > Open Video Scopes.
Result
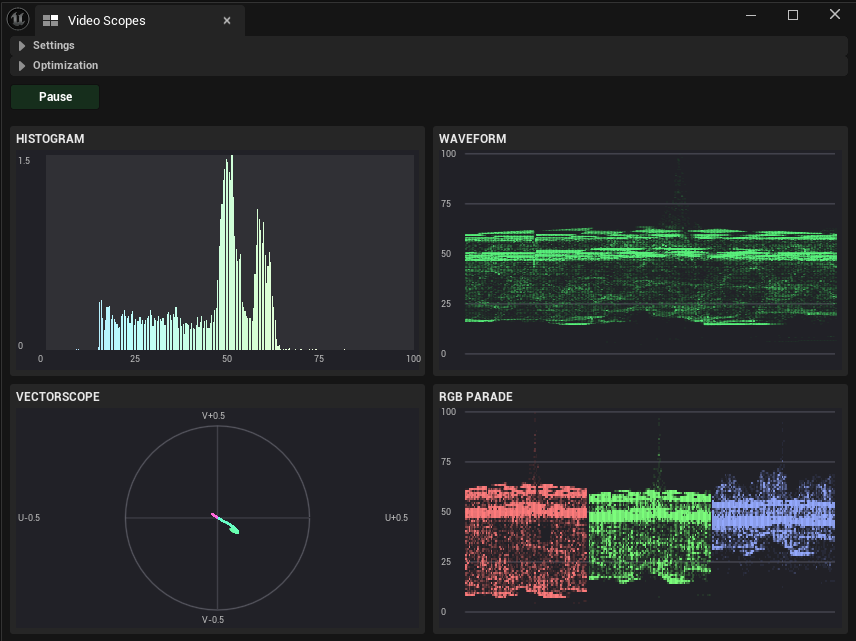
- A dockable panel will open with all four scopes. Scope capture enables automatically.
You can also toggle capture on/off from Window > Video Scopes > Toggle Capture.
Interface Overview
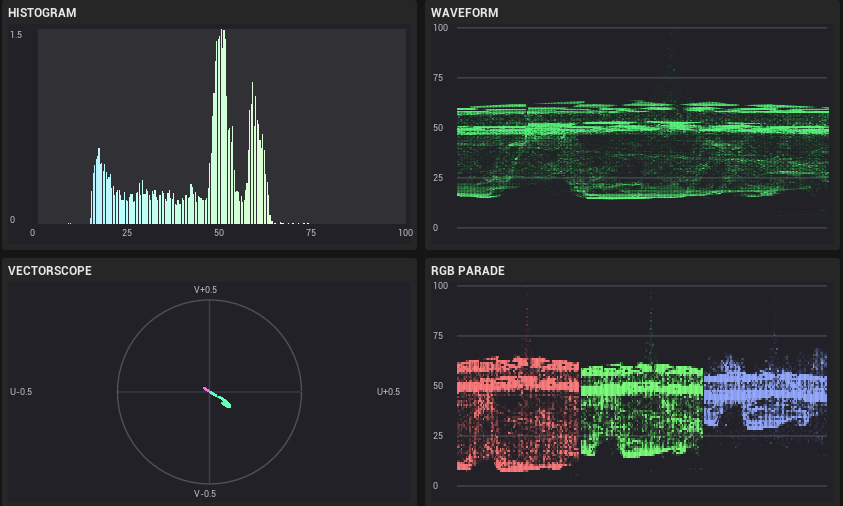
The scopes are arranged in a 2x2 grid:
Above the grid is a collapsible Settings section, and a Pause/Resume button.
Understanding the Scopes
Histogram
Shows the overall luminance distribution of the viewport.The X-axis represents brightness (0% dark to 100% bright) and the Y-axis shows how many pixels exist at each brightness level.
- Useful for checking if your image is underexposed (data bunched on the left) or overexposed (data bunched on the right).
- A well-exposed image typically shows a spread across the full range.
Waveform
Displays luminance across the horizontal axis of the image.Each column of the waveform corresponds to the same column in the viewport.The vertical axis represents brightness.
- Great for spotting uneven exposure across the frame.
- Shows if highlights are clipping or shadows are crushed.
Vectorscope
A circular chrominance plot showing color saturation and hue.Points near the center are desaturated; points farther out are more saturated.The angle represents hue.
- Useful for checking color balance and identifying color casts.
- A neutral scene should cluster near the center.
RGB Parade
Three side-by-side waveforms showing the Red, Green, and Blue channels independently.
- Essential for white balance: all three channels should align at the same level for neutral colors.
- Quickly reveals per-channel clipping or imbalance.
Settings
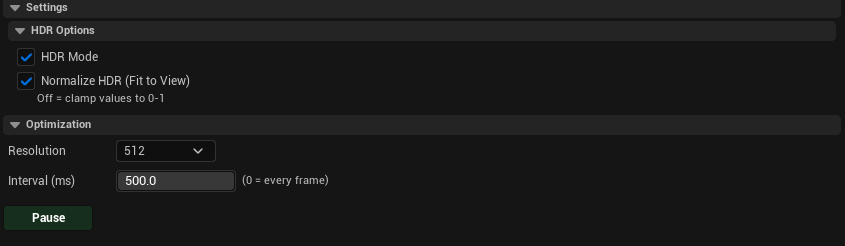
Expand the Settings section (collapsed by default) to access:
HDR Options
| Setting | Default | Description |
|---|---|---|
| HDR Mode | On | When enabled, scopes display the full floating-point HDR range. When off, values are clamped to 0-1 |
| Normalize HDR (Fit to View) | On | Auto-scales scopes to the detected maximum luminance in the scene. Only active when HDR Mode is on |

Optimization
| Setting | Default | Description |
|---|---|---|
| Resolution | 512 | Capture texture resolution. Options: 128, 256, 512, 1024. Lower = faster, higher = more accurate |
| Interval (ms) | 500 | Time between scope updates. 0 = every frame (highest performance cost). Higher values reduce CPU load |

Pause / Resume
Click the Pause button (green) to freeze the scopes on the current frame.The button turns amber and changes to "Resume".Click again to resume live updates.
- Useful for analyzing a specific frame without the data constantly changing.
- The viewport continues to render normally; only the scope display freezes.
Tips
- Start with Resolution 256 and Interval 500ms for minimal performance impact while working, then increase resolution for final analysis.
- Use the Histogram in combination with Color Match to verify your color grade covers the full tonal range.
- The Vectorscope is your best tool for checking white balance. Adjust color grading until neutral elements cluster at the center.
- Dock the Video Scopes panel alongside your viewport for continuous monitoring while you work.