Overview
SHADER OPTIMIZATION SUITE
User Guide & Technical Reference
A practical guide to finding expensive materials, sampler pressure, Nanite/Lumen risks, and shader permutation growth before they become production problems.
Contents
- Overview and quick start
- Editor integration
- MCV Hotspots and overlay
- Texture Analysis
- Nanite & Lumen Audit
- Shader Permutation Bloat Scanner
- Broom cleanup tool
- Shader compilation controls
- Settings reference
- Troubleshooting and interpretation11. Technical notes and release checklist
- Troubleshooting and interpretation
- Technical notes and release checklist
1. Overview and quick start
Shader Optimization Suite is an editor-only Unreal Engine plugin for turning material and shader complexity into actionable information. It is designed for artists and technical artists first, while keeping enough detail for rendering engineers to validate the numbers.
| Tool | Use it when you need to… |
|---|---|
| MCV Hotspots | Find expensive nodes and understand what drives their cost. |
| Texture Analysis | Check sampler pressure, texture usage, and packing opportunities. |
| Nanite & Lumen Audit | Review material compatibility and likely rendering risks. |
| Permutation Bloat Scanner | Estimate how static switches and usage flags multiply shader variants. |
| Broom | Dim or remove dead material nodes while keeping the graph readable. |
Quick start
- Enable the ShaderOptimizationTool plugin and restart the editor if prompted.
- Open a material in the Material Editor. The MCV button is available in the material toolbar.
- Use Open Analysis Window to inspect all three analysis tabs. Refresh Analysis repeats every calculation for the current selection.
- For project-level shader controls, use the Shader Optimization section in the Level Editor toolbar.

2. Editor integration
The plugin loads as an Editor module after engine startup. It adds commands to the Level Editor, Material Editor, and Content Browser without changing cooked runtime behavior.
| Location | Visual | Commands |
|---|---|---|
| Level Editor toolbar | Skip Shader Compilation · Lambert View · Flush Shader Queue · Recompile All Shaders · Shader Permutation Bloat Scanner | |
| Material Editor toolbar | MCV · Broom | |
| MCV dropdown | Enable MCV Overlay · Open Analysis Window · Refresh Analysis · Texture Sampler Analysis · Nanite & Lumen Audit | |
| Content Browser | Nanite & Lumen Audit · Scan Permutation Bloat… |

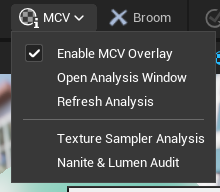
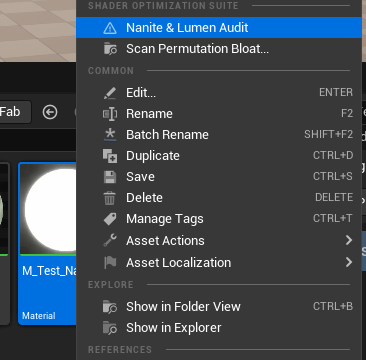
The analysis window is reusable. Each command updates its context, selects the requested tab, and brings the window to the front. A single material uses the title “Material Optimization Analysis — <MaterialName>”; multiple materials use “Material Optimization Analysis — N Materials”.
3. MCV Hotspots and overlay
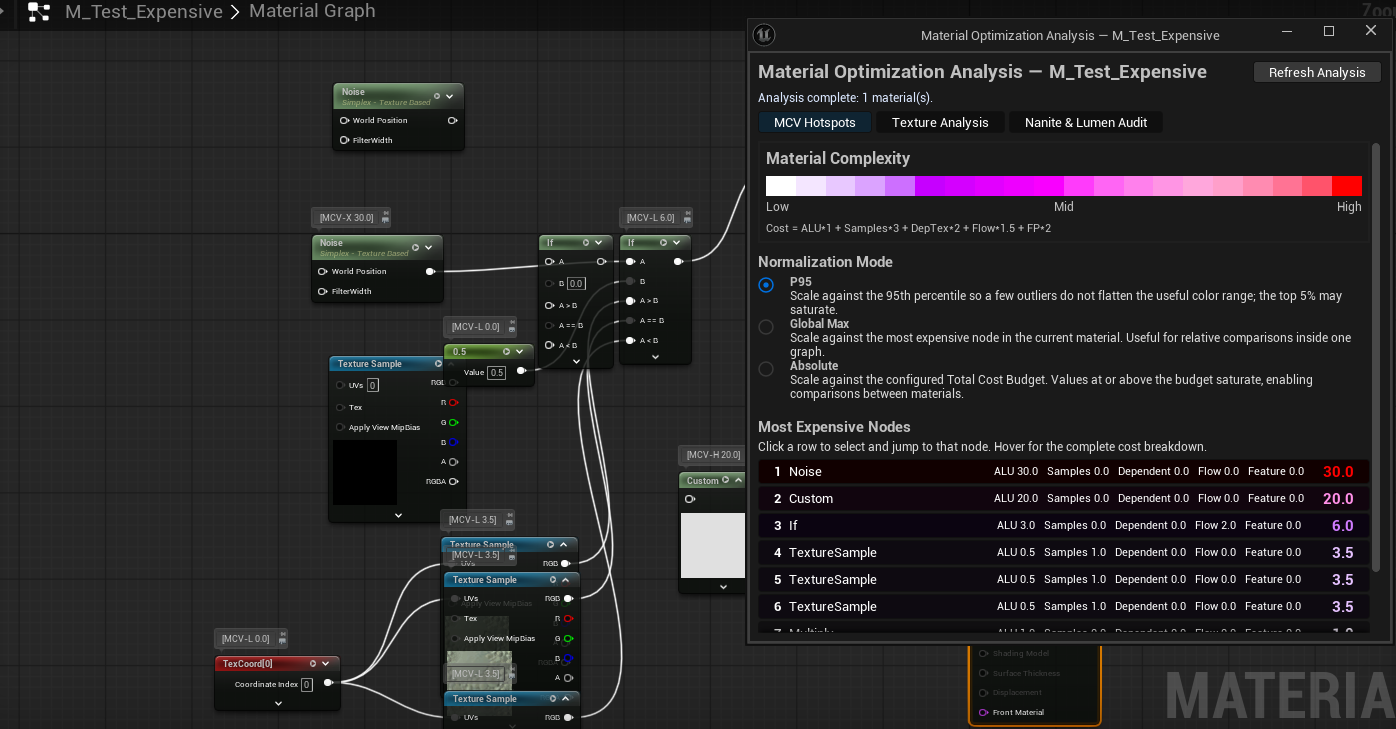
MCV (Material Complexity Visualization) ranks material expressions using a weighted estimate of ALU work, texture samples, dependent reads, flow control, and feature penalties. The goal is not a GPU profiler replacement; it is a fast way to see which nodes deserve attention.
What the overlay shows
- Every analyzed node receives a temporary label in the form [MCV-L cost], [MCV-M cost], [MCV-H cost], or [MCV-X cost].
- Labels are written to the material graph node comment and its bubble visibility, which is the representation Unreal Engine 5.7 actually displays.
- Connections are colored with the MCV gradient and their thickness follows normalized cost. Show Wires is respected.
- Turning the overlay off restores each node’s exact original comment and visibility. Closing the Material Editor or unloading the plugin also restores the saved state.
- Refresh Analysis replaces prior MCV labels instead of leaving stale prefixes behind. Opening a material with MCV already enabled reapplies the visual layer automatically.
Cost model
| Component | What it represents |
|---|---|
| ALU | Arithmetic and logical operations. |
| Samples | Texture and other sampling work. |
| Dependent Reads | Reads whose coordinates depend on earlier results. |
| Flow | Branches, loops, and other control-flow pressure. |
| Feature Penalty | Extra weight for features known to be costly or risky. |
The total is a weighted score. Budgets are editable in project settings, so the same score can be tuned to match the team’s material style and target hardware.
Normalization modes
| Mode | Meaning |
|---|---|
| P95 | Uses the 95th percentile as the reference. A few outliers do not flatten the contrast for the rest of the graph. |
| Global Max | Compares nodes with the most expensive node in the current material. |
| Absolute | Compares against BudgetTotal, making colors comparable across materials. |
Changing the mode recalculates the ranking, labels, and wire colors immediately. Click a row in MCV Hotspots to select and focus the corresponding node in the Material Editor.
4. Texture Analysis
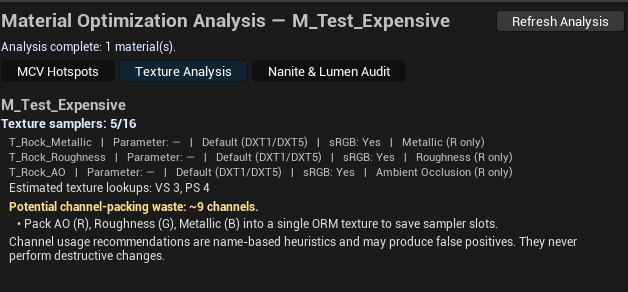
Texture Analysis reports sampler pressure and highlights patterns that are easy to miss. The warning threshold is 12 samplers; when compiled statistics are unavailable, results are marked Estimated and use a conservative fallback limit of 16 without forcing shader compilation.
- Each row includes texture, parameter name, compression, sRGB state, and inferred use.
- The analyzer flags separate AO, Roughness, and Metallic textures, repeated samplers, and channels that could be packed together.
- Recommendations are deliberately practical: pack compatible channels, reuse parameters, and avoid duplicate samples where the material can share one read.
- Results stay in the analysis window; no floating notification is used for the final report.
5. Nanite & Lumen Audit
The audit checks selected materials against common Nanite and Lumen constraints and explains what to change. Results are grouped by material and always include clean materials, so an empty issue list is an explicit result rather than missing data.
| Severity | Typical interpretation |
|---|---|
| Info | A note or compatibility detail worth keeping in mind. |
| Warning | A configuration that may reduce quality or cost more than expected. |
| Error | A likely incompatibility or a setting that needs a deliberate fix. |
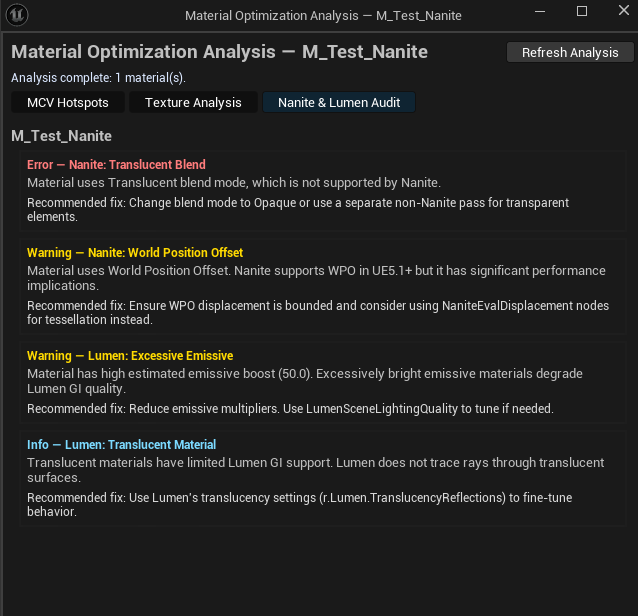
Each finding includes a category, description, and recommended solution. The same “Nanite & Lumen Audit” label is used in the dropdown, tab, Content Browser, and documentation. A multi-selection from the Content Browser opens the same reusable window and recalculates all selected materials.
6. Shader Permutation Bloat Scanner
The scanner is a fast planning tool for static-switch growth. It analyzes UMaterial assets, not Material Instances, and produces a heuristic estimate rather than the exact number of shaders the engine will compile.
Estimate used by the scanner
| Term | Formula / definition |
|---|---|
| BasePermutations | 2^min(StaticSwitchCount, 40) |
| UsageMultiplier | 2^number of active usage flags |
| EstimatedTotal | BasePermutations × UsageMultiplier |
Both StaticSwitchParameter and StaticSwitch expressions are counted. The 40-switch cap prevents the estimate from overflowing into an unhelpful number while still making the growth curve visible.
Usage flags included
The multiplier can include Static Lighting, Skeletal Mesh, Particle Sprites, Beam Trails, Mesh Particles, Niagara Sprites, Niagara Ribbons, Niagara Mesh Particles, Instanced Static Meshes, Geometry Collections, Water, Hair Strands, Lidar Point Cloud, and Virtual Heightfield Mesh. The scanner shows the active flags in its tooltip so the multiplier can be checked by hand.
How to validate M_Test_Permutations
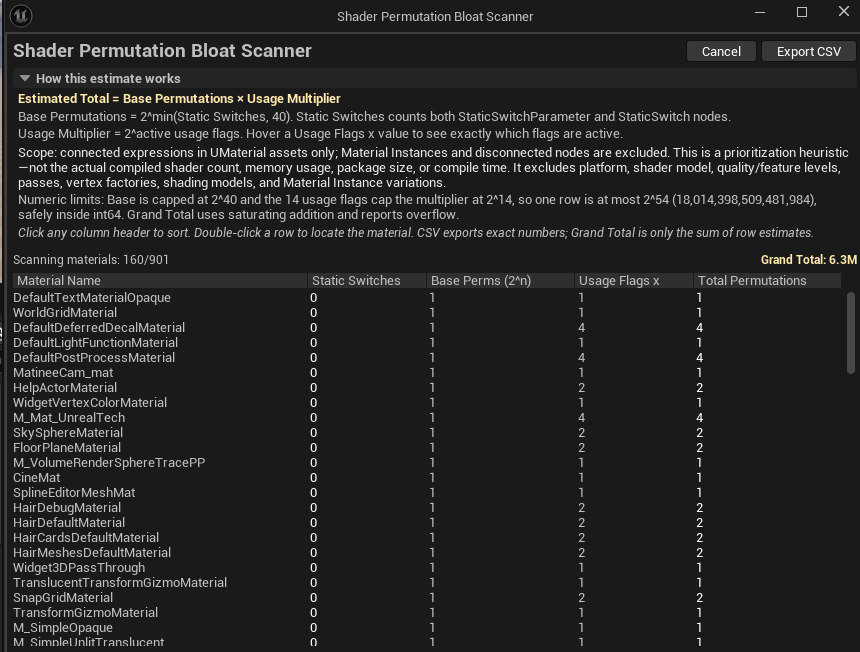
- Three switches must report Base Perms = 8.
- Confirm the displayed multiplier equals 2^n for the flags shown in the tooltip.
- Confirm Total Permutations = 8 × UsageMultiplier.
- Try ascending and descending sorting; the order should reverse without changing values.
- Double-click the row and verify that the Content Browser selection follows it.
- Export CSV and confirm the headers are correct and values are written in full, without abbreviated suffixes.
The Grand Total is the sum of the estimates in the report. It is not memory usage and it is not a direct compile-time prediction. Platform, shader model, quality level, feature level, rendering passes, vertex factories, shading models, and instance-specific behavior are outside this heuristic.
7. Broom cleanup tool
Broom is a graph cleanup aid for dead or unused nodes. It dims candidates first so the artist can review the result. Delete reanalyzes the graph, asks for confirmation with the current node count, and removes only the revalidated set through the standard Material Editor workflow, so the action can be undone. Dim adds a [DEAD] prefix to the graph node comment; Restore removes only that prefix and preserves the rest of the user's comment. Use Broom as a presentation and maintenance tool; it is not a substitute for understanding why a node became disconnected.
8. Shader compilation controls
| Command | Purpose | |
|---|---|---|
| Skip Shader Compilation | Temporarily pauses material shader compilation. Uncompiled materials use the fallback World Grid Material. | |
| Lambert View | Switches the viewport to a simple lighting view for material inspection. | |
| Cancel Material Shader Compilation | Cancels outstanding material shader compilation jobs for currently loaded materials. Global shader jobs are not affected. | |
| Recompile All Shaders | Collects materials used by the current level and queues a full recompilation for those materials; it does not recompile every project or global shader. | |
| Shader Permutation Bloat Scanner | Estimates shader permutation growth from static switches and active usage flags. |


9. Settings reference
| Setting | Default / values | Notes |
|---|---|---|
| Enable MCV Overlay | Off | Stores the editor preference for the visual layer. |
| MCV Normalization Mode | P95 | P95, Global Max, or Absolute. |
| MCV Show Wires | On | When off, no wire colors are registered. |
| Total Cost Budget | 300 | Reference for Absolute normalization. |
| ALU Budget | 250 | Weighted arithmetic budget. |
| Texture Sample Budget | 64 | Sampling reference. |
| Control Flow Budget | 80 | Branch/loop reference. |
| Dependent Reads Budget | 64 | Dependent-read reference. |
| Feature Penalty Budget | 100 | Feature-specific weight. |
| Emissive Boost Warning Threshold | 10 | Nanite/Lumen audit threshold. |
Settings are editor-facing and can be tuned per project. Changing budgets affects presentation and prioritization; it does not alter the material or the renderer.
10. Troubleshooting and interpretation
| Symptom | What to check |
|---|---|
| No MCV labels | Confirm that the material is open and MCV is enabled. Disable and re-enable MCV, then use Refresh Analysis. If the graph was edited, reopen the Material Editor. |
| Wires stay gray | Show Wires may be disabled, or the graph has not been refreshed after changing normalization. |
| Texture count looks high | Check repeated samples and whether AO/Roughness/Metallic can be packed. |
| Audit is empty | An explicit clean-material row is expected; verify the selected asset is a material, not an instance. |
| Permutation number seems huge | That is the intended exponential warning. Review static switches and active usage flags before treating it as a compile-time fact. |
| Comments changed after a crash | Reopen the Material Editor and verify the graph before saving. The overlay restores comments before save and does not intentionally serialize presentation changes; after an unexpected editor close, this check is a sensible precaution. |
Treat every number as a prioritization signal. GPU captures, shader compiler output, platform profiles, and real content remain the final authority for performance decisions.
11. Technical notes and release checklist
The plugin is an Editor module loaded at PostEngineInit. Its UI is built with Slate and editor menu extensions. MCV graph annotations are presentation state: the implementation saves and restores NodeComment and bCommentBubbleVisible, avoids material Modify calls and recompilation, and restores the graph before save. The analysis window owns the presentation for hotspots, textures, and audits, which keeps results in one place and avoids transient notifications.